With many e-commerce options Thailand, but we dove into some data points for six of them to compare and contrast.
-- Tagtoo
Since the alliance of Southeast Asian countries a few years ago, the huge domestic demands in these emerging markets has caught the attention from all over the world.
This phenomenon has been compounded by the increase in mobile penetration and an addiction to social networks such as Facebook and Instagram. Southeast Asia, nowadays, is absolutely no longer as undeveloped previous stereotypical prejudices.
One of the biggest benefactors recently has been the e-commerce industry and one of the largest countries in the region is Thailand.
While, there are a great number of e-commerce platforms in Thailand, we chose six companies to be our pinpoint for an in-depth investigation.
Hopefully the data is helpful and offers further insights to assist e-commerce players and readers better understand future growth directions.
Most of the companies are listed as top ten websites on SimilarWeb. By looking into the data, we are trying to better understand their strategies implemented in Southeast Asia and deduce the survival model for e-commerce players in Thailand.


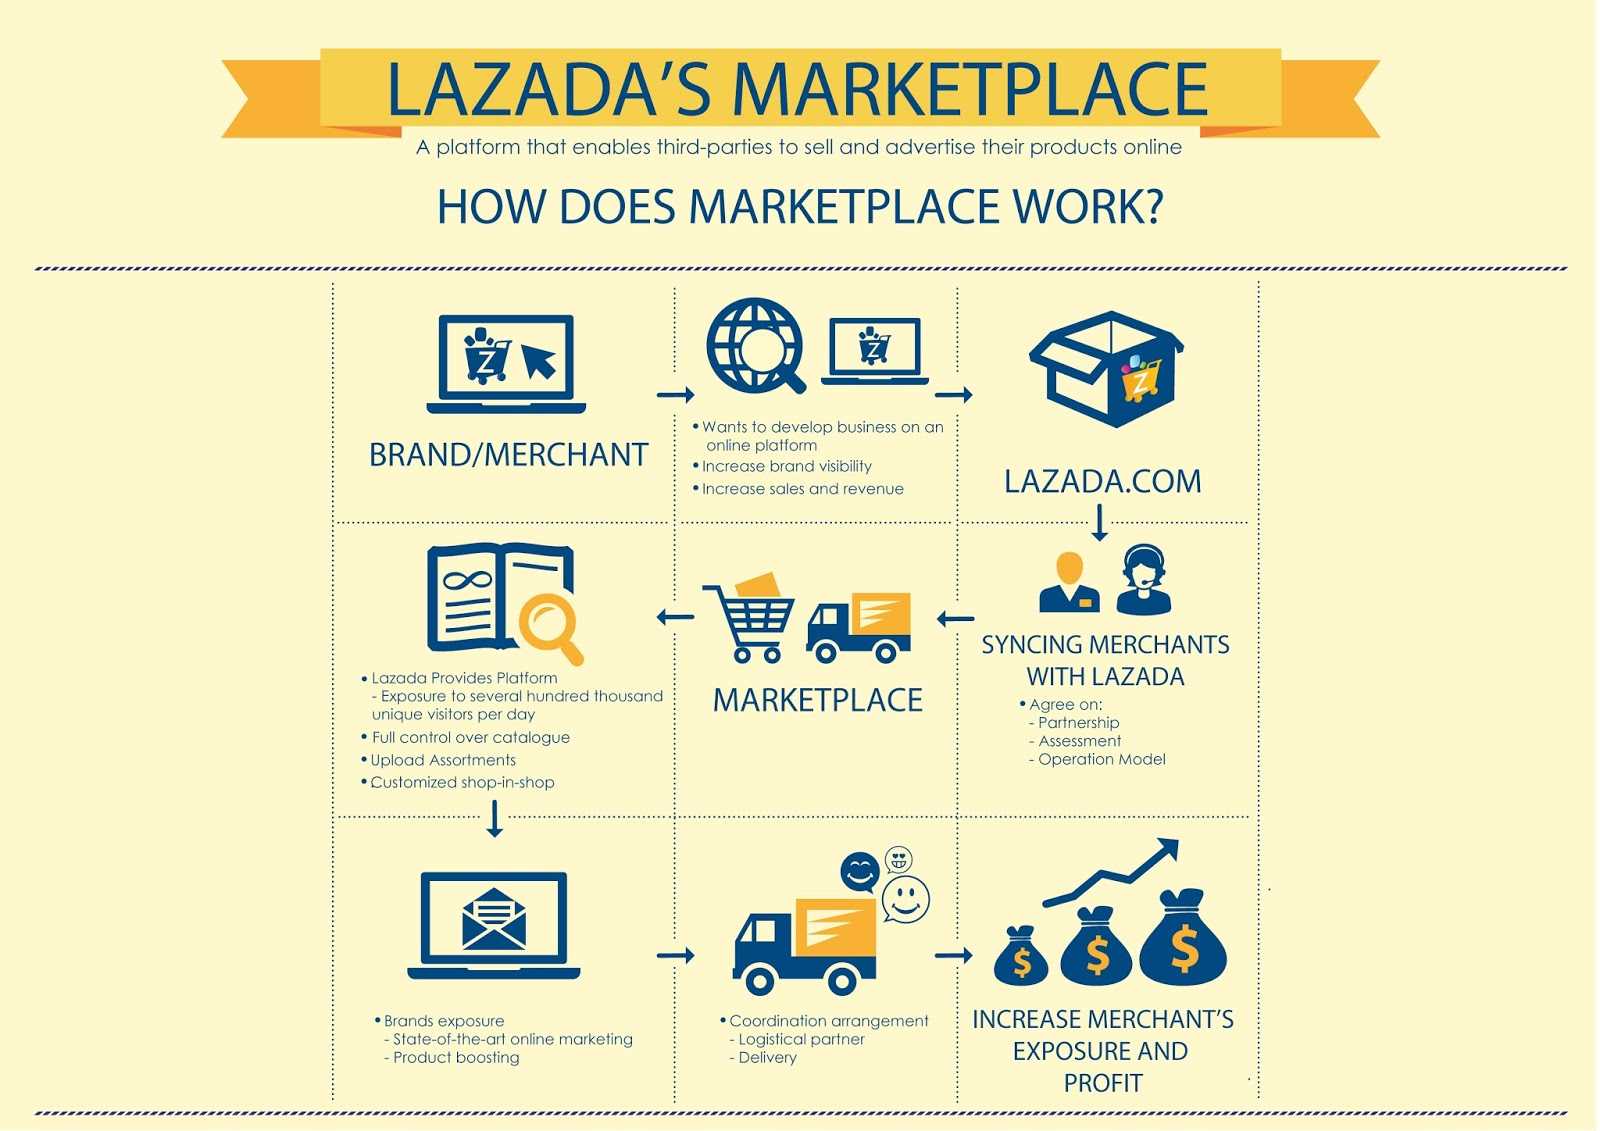
To begin with, let’s get started with Lazada, a Rocket Internet-backed startup. This brand should be extremely familiar to most readers because of the astonishing media coverage it enjoys.
Unsurprisingly, the total visit stats amount to 25 million, the highest number among six companies.
Also, the bounce rate is fairly good as compared with the other five companies. However, when we move on to ‘time spent on the website’ and page numbers browsed by user, the performance of Lazada falls below expectations.
In addition, the same phenomenon coincidentally happens on Facebook. Ladaza has the most fans on its Facebook page while, at the same time, the engagement rate is only 0.33 percent.
This reflects the same adverse situation in its official website, suggesting there is room for improvements in the maintenance of customer loyalty and brand awareness.

Most notably, as we take a look at the graph of ‘Percentage of Traffic Source’, it discloses more insights to a companies strategies.
In contrast to the other five companies, the percentage of Lazada ‘Display Ad’ and ‘Referral’ go up to 19.04 and 29.85 respectively.
It implies the budget allocation into online marketing campaign occupy most of its traffic source. Moreover, the scarce number of organic search is evidence as well. As a result, by this data alone, one can catch a glimpse at the strategy being implemented by Lazada.

On the other hand, the second player, Kaidee, is doing relatively well as compared to the performance of Lazada.
Although there is a huge gap between the total visits — nearly half — between the top-two brands, it is obvious its internet users are more willing to embrace the design and the information provided by Kaidee.
Apart from that, the low Bounce Rate along with higher Time On Site and excellent Page Views verifies our speculation. In other words, Kaidee customers appear more loyal which can lead to them spending more money
Let’s turn to the Percentage of Traffic Source. It clearly explains our earlier assumption by showing an outstanding number in Direct and Organic Search, which trumps Lazada by over 32.4 percent.
However, on Facebook low Engagement Rate shows Kaidee does not make enough effort in social marketing. Poor and unoriginal content could play a decisive role.
Now, it must be noted this is based on the limited access to data available SimilarWeb, but, I believe the sorted and graphed information is helpful for brand comparison.
Note: The data came from SimilarWeb is only based on desktop. There may be difference if one include the mobile-based data.-
Author: Edison Chen, Business Development Manager at Tagtoo
